Why Your Group Dashboard Lies — And How to Build One That Doesn't

Most group BI implementations produce dashboards that are technically accurate and managerially useless. The finance team maintains a parallel Excel model because the dashboard and the management accounts never fully agree. The root cause is not the tool. It is the data architecture underneath it - and switching platforms will not fix what the platform did not break.
The data quality problem most Group CFOs underestimate
Gartner research puts the average annual cost of poor data quality at $12.9 million per organisation. In a multi-entity group, the damage is structurally compounded: every report, every board pack, and every decision downstream inherits whatever inconsistencies live in the data foundation beneath the BI layer. The platform does not diagnose those inconsistencies. It renders them with greater visual fidelity.
In our work with finance functions across mid-market groups in Europe, more than half of BI implementations delivered material value only after the underlying data architecture had been corrected - a step that was not scoped in the original project and that costs between one and three times the initial BI investment to address retrospectively. This is not a failure of technology selection. The platforms are capable. It is a failure of sequencing: the tool was deployed before the foundation was ready. In a single entity, that mistake is recoverable. In a group with eight entities, three ERPs, and five years of accumulated accounting conventions, it is not.
The pattern repeats across ownership structures. PE-backed groups face it when portfolio reporting standards collide with entity-level accounting practices accumulated before the fund's involvement. Organic groups face it when subsidiaries built or acquired at different times have never been brought to a common data standard. Post-M&A businesses face the most acute version - newly consolidated entities that were designed to be standalone and are now expected to report into a group view they were never architected to support.
Four structural failure modes of a group consolidation dashboard
The mechanics of failure are consistent across groups at different scales and ownership structures. Understanding them is the diagnostic step that most BI projects skip.
Mismatched charts of accounts. In groups built through acquisition or organic expansion, each entity develops a cost structure suited to its own operations. Revenue account codes differ. Overhead is categorised differently. Cost of goods sold may include items that another entity records as operating expense. When the consolidation layer maps these together, it applies translation assumptions - and those assumptions introduce systematic errors that are invisible at the aggregate level. The dashboard shows a consolidated figure. That figure is the arithmetic sum of incompatible components.
Inconsistent close timing. Some entities close on the last calendar day of the month. Others close on the last working day. Subsidiaries acquired through M&A may carry a different fiscal year. The consolidated dashboard assembles its view from data captured at different points in time. That inconsistency is absorbed silently into the reporting layer and expressed as month-to-month variances that the finance team learns to explain away rather than eliminate.
Intercompany revenue and cost not eliminated. Management fees, shared service charges, intragroup platform costs, intercompany loans - in a group with significant intragroup activity, these transactions inflate consolidated revenue and cost simultaneously. Research on finance close benchmarks finds that intercompany reconciliation and elimination accounts for 35-45% of close complexity in groups with more than four entities. When elimination is manual, depends on institutional knowledge, and is applied after the fact, the group margin is wrong by construction. The dashboard presents the unadjusted number. Nobody flags it until the auditor does.
Margin definitions that differ by entity. Gross margin in the SaaS subsidiary includes a different set of cost inclusions than gross margin in the distribution entity. The consolidated margin figure is an arithmetic average of incompatible definitions, presented under a single label. When margins fall, the dashboard cannot tell you whether the deterioration is operational, definitional, or an artefact of allocation methodology.
The four diagnostic questions before any BI deployment
Finance leaders who have run BI implementations in complex group structures converge on a common prior step: the data architecture diagnostic. Four questions determine whether a group is genuinely BI-ready. Honest answers determine the scope of preparatory work required before platform selection is meaningful.
Do all entities operate from the same chart of accounts? Not mapped to a common chart through translation logic applied at consolidation - actually using the same account codes, with the same meaning, in every entity's ERP. Translation logic introduces potential error at every mapping step. A unified chart eliminates the error at source. This is the most politically difficult requirement in most groups and the most technically important one.
Are intercompany positions eliminated automatically at month-end? Manual elimination, applied by a knowledgeable individual after the fact, is the highest-risk step in group close. It depends on institutional knowledge that is not documented and is not resilient to personnel change. Automated IC elimination - triggered by the data, not by a person - is a prerequisite for a consolidated view that can be trusted without manual validation.
Are KPI definitions enforced consistently across entities? Gross margin, EBITDA, working capital - if defined differently in different entities, the consolidated view is an arithmetic sum of incompatible calculations. Until definitions are standardised and encoded in the data model, analysis of group performance is structurally imprecise, regardless of the sophistication of the reporting layer.
Is there a single enforced close calendar? A group that closes on different days in different entities assembles a consolidated view from data captured at different points in time. A single close calendar is an organisational discipline requirement before it is a technology question. Without it, the timing inconsistency will surface as unexplained variances in every reporting cycle.
The case that changed the sequencing: EUR 140M logistics group
A PE-backed logistics group, EUR 140M revenue, 9 entities across four countries, commissioned a BI implementation following pressure from its fund to improve reporting cadence. The project was scoped at EUR 280,000 over six months. The dashboard went live on schedule in month seven.
By month ten, two parallel reporting processes were running. The finance team used the controller's Excel consolidation for the monthly board pack - the only version they were willing to present without qualification. The dashboard served for operational KPI tracking within individual entities. The Group CFO could not answer the question the fund's Investment Manager was asking: which entity drove the margin deterioration in Q3?
The data architecture assessment that followed identified three root causes. The German and Polish entities used different chart of accounts versions - the German entity had been acquired in 2019 with its own CoA that was never harmonised to the group standard. Intercompany management fees between the holding and three subsidiaries were partially eliminated in the Excel model but not configured for elimination in the BI data model. Two entities closed on the last working day; three closed on the last calendar day - a timing gap of zero to three days that produced systematic variances in the monthly consolidated view.
Remediation took 14 weeks. After completion, the BI dashboard became the sole reporting tool. Close moved from day 17 to day 8. Board pack preparation dropped from five days to one. The fund's Investment Manager endorsed the numbers for the first time without requesting manual reconciliation. The EUR 140,000 remediation cost was recovered within two quarters through reduced finance headcount and faster close.
The correct sequence and why it is non-negotiable
The temptation, when a BI implementation fails to deliver trust, is to attribute the failure to platform selection. A different tool, the reasoning goes, would have handled the data inconsistency better. This reasoning is consistently wrong. Gartner's research on BI implementation failures finds that data quality and data governance account for 70% of failed implementations across industries. Platform capability accounts for less than 10%.
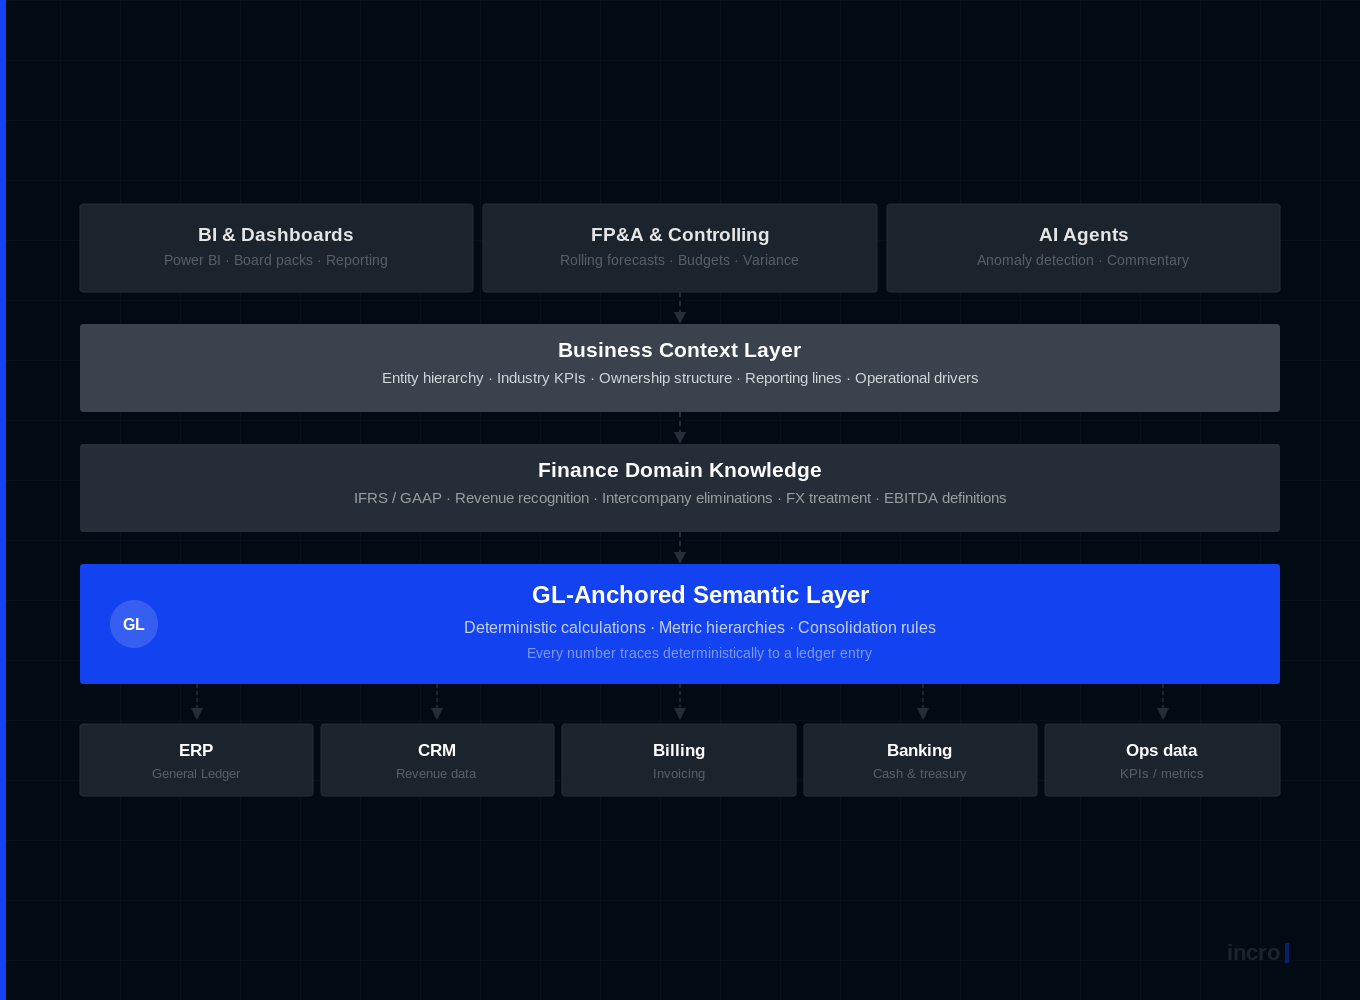
The correct sequence is non-negotiable: standardise the chart of accounts, define and automate intercompany elimination, enforce a consistent close calendar, build a GL-anchored semantic layer that computes metrics deterministically, then build the dashboard on top. Each step is a prerequisite for the one that follows. Skipping any step transfers the unresolved problem downstream - where it is more expensive, more visible, and more difficult to fix without disrupting a system that is already running.
The implication for Group CFOs is direct. Before the next BI budget is approved, before platform selection begins, the foundation questions need honest answers. If the answers reveal structural problems - and they usually do - the scope of the BI project must include the data architecture work. The alternative is a third iteration of the same expensive mistake.
If your group dashboard requires a footnote explaining why its numbers differ from the management accounts - talk to us about what the data architecture looks like today, and what it would take to build a consolidated view that stands on its own.
Matt co-founded incro in 2020. Since then, he has worked with over 100 companies - from early-stage startups to PE-backed businesses across a wide range of industries.
He is an expert in corporate finance, FP&A set-up, and forecasting, and has built a reputation for turning complex financial functions into clear, board&investor-ready systems.
At incro, Matt drives company growth while designing the analytical frameworks and solutions that define how the firm delivers transformation — including co-creating CFO Studio, incro's AI-powered financial analysis platform.
He holds a degree from SGH Warsaw School of Economics and is the author of Methods and Procedures in the Assessment of Capital Investments (Difin, 2023), a rigorous framework for evaluating investment profitability, now used as an academic reference. Matt was named to the Forbes 30 Under 30 Poland list in 2025.
Your financial data won't fix itself.
30 minutes. We'll tell you exactly where your data is costing you money — and what AI can do about it.